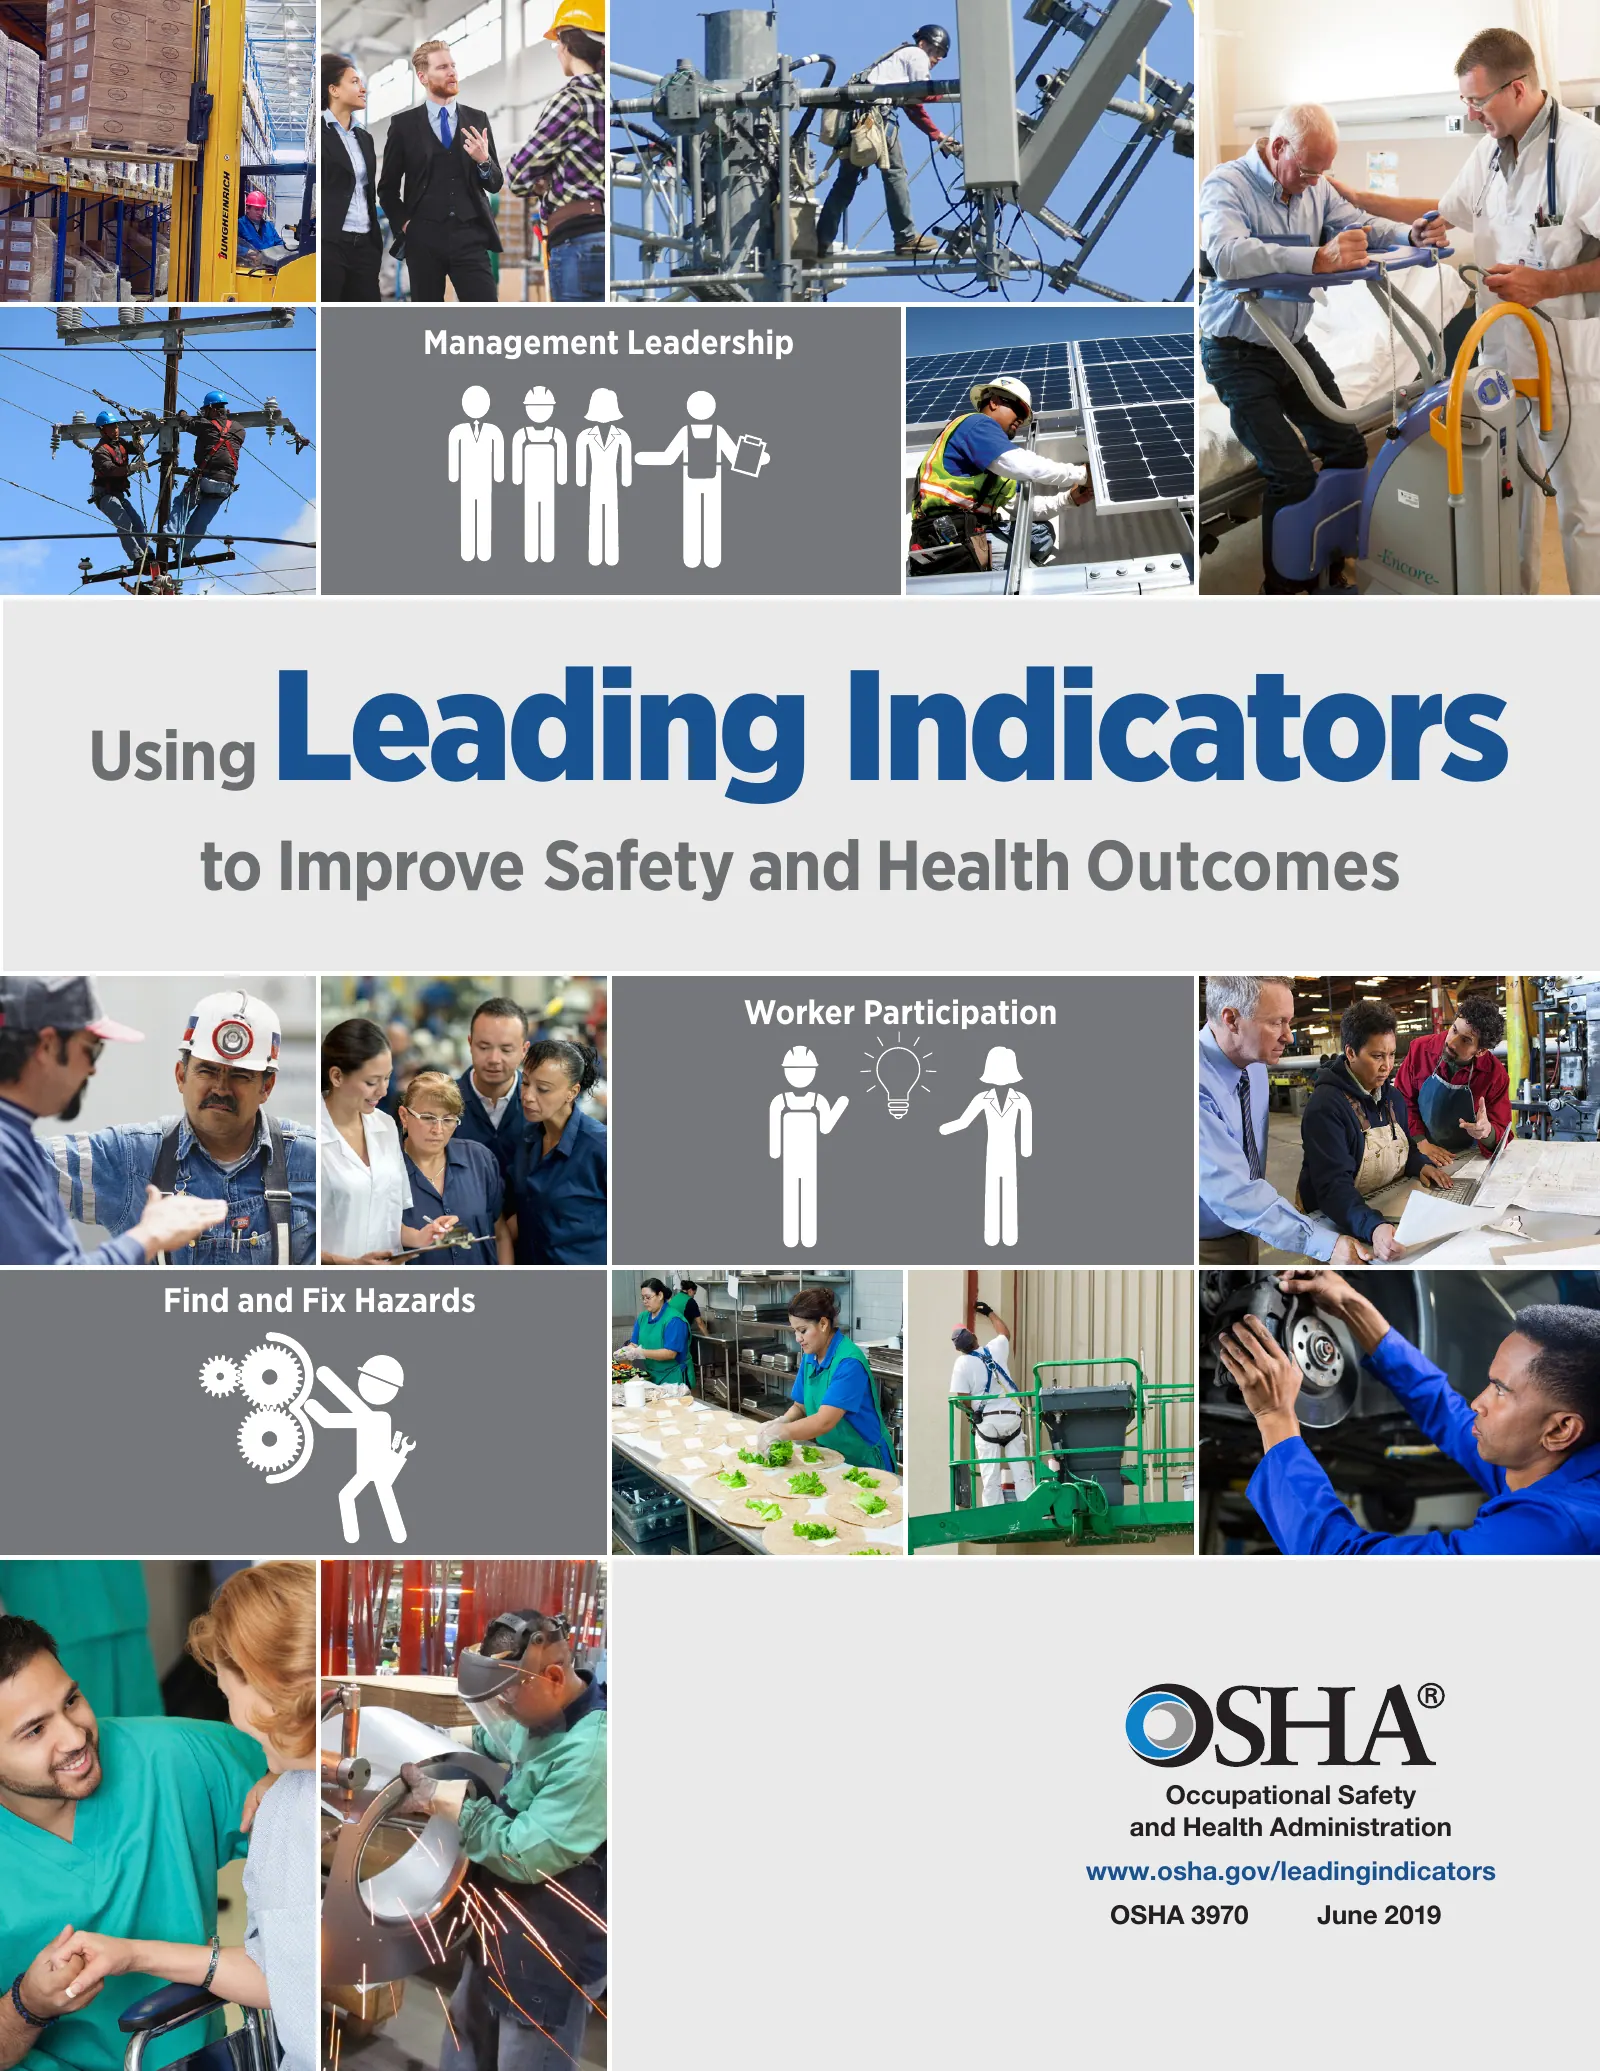
Safety and Health Programs: Using Leading Indicators to Improve Safety and Health Outcomes (OSHA 3970)
How to pick and use leading indicators to improve safety and health outcomes.
Page text
· 18 pages · by U.S. Department of Labor, OSHA
The words on each page as the author wrote them, read from the file by software so they can be searched. Layout, pictures and tables are not shown here, and long pages are shortened: the pages above and the download are the original.
- Page 1
Leading Indicators
- Management Leadership
- Using
- to Improve Safety and Health Outcomes
- Worker Participation
- Find and Fix Hazards
- Occupational Safety
- and Health Administration www.osha.gov/leadingindicators
- OSHA 3970
- June 2019
- Page 2
CONTENTS
- SECTION 1. INTRODUCTION TO LEADING INDICATORS … 2
- 1.1 What Are Leading Indicators? … 2
- 1.2 The Benefits of Using Leading Indicators … 2
- 1.3 Characteristics of Effective Leading Indicators … 2
- SECTION 2. USING LEADING INDICATORS … 4
- 2.1 Leading Indicators Based on Data You Are Already Collecting … 5
- EXAMPLE: Percentage of Workers Attending Safety Refresher Training … 5
- 2.2 Leading Indicators for Controlling an Identified Hazard … 6
- EXAMPLE: Inspection and Clearing of Walkways … 6
- EXAMPLE: Truck Brake Replacement … 7
- EXAMPLE: Arrival Time of Lift Teams … 9
- 2.3 Leading Indicators to Improve an Element of Your Safety and Health Program … 10
- 2.3.1 Management Leadership … 10
- 2.3.2 Worker Participation … 11
- 2.3.3 Hazard Identification and Assessment … 11
- 2.3.4 Hazard Prevention and Control … 12
- 2.3.5 Education and Training … 12
- 2.3.6 Program Evaluation and Improvement … 13
- 2.3.7 Communication and Coordination … 13
- 2.3.8 EXAMPLES: Using Leading Indicators to Improve a Safety and Health Program Element … 14
- SECTION 3. CONCLUSION … 17
- ACTION PLAN CHECKLIST … 17
- This document is not a standard or regulation, and it creates no new legal obligations. It lacks the force and effect of law, except as authorized by law or as incorporated into a contract. The recommendations are advisory in nature, informational in content, and are intended to assist employers in providing a safe and healthful workplace. Material contained in this publication is in the public domain and may be reproduced, fully or partially, without permission. Source credit is requested but not required.
- Page 3
SECTION 1. INTRODUCTION TO LEADING INDICATORS
- Employers are encouraged to use this document to learn how they can use leading indicators to improve safety and health outcomes in the workplace. While large businesses may already be familiar with the benefits of using leading indicators, many small and medium-sized businesses may not know what they are or how to use them. This document can help such businesses get started. This document may also be useful to large businesses seeking new approaches to using leading indicators.
- 1.1 What Are Leading Indicators?
- For purposes of this document, leading indicators are proactive, preventive, and predictive measures that provide information about the effective performance of your safety and health activities. They measure events leading up to injuries, illnesses, and other incidents and reveal potential problems in your safety and health program. In contrast, lagging indicators measure the occurrence and frequency of events that occurred in the past, such as the number or rate of injuries, illnesses, and fatalities.
- In addition to the social benefits, employers that use leading indicators to find and fix hazards can realize direct savings to their bottom line. These include savings in repair costs, production costs, workers’ compensation costs, and other legal and regulatory costs that are commonly associated with incidents. For example, by fixing hazards that lead to roadblocks in production, employers may be able to complete daily tasks more efficiently and reduce production costs related to those activities.
- While lagging indicators can alert you to a failure in an area of your safety and health…
- …
- Page 4
Example Leading indicator: Number of workers who attend a monthly safety meeting
- Accountable: Does your leading indicator track an item that is relevant to your goal?
- Reasonable: Can you reasonably achieve the goal that you set for your leading indicator?
- Timely: Are you tracking your leading indicator regularly enough to spot meaningful trends from your data within your desired timeframe?
- The chart below demonstrates how to create a SMART leading indicator to address the issue that workers have not been attending monthly safety meetings. It walks through a good and bad example for meeting each SMART criterion using the leading indicator “Number of workers who attend a monthly safety meeting.”
- Goal: 97% worker attendance rate at monthly safety meetings
- SPECIFIC: Does your leading indicator provide specifics for the action that you will take to minimize risk from a hazard or improve a program area?
- GOOD EXAMPLE
- BAD EXAMPLE
- Workers will attend a safety meeting every month.
- Safety meetings will be held monthly.
- This is specific because it clearly identifies what the activity is and who needs to attend.
- This is not specific because it does not describe who needs to attend.
- MEASURABLE: Is your leading indicator presented as a number, rate, or percentage that allows you to track and evaluate clear trends over time?
- BAD EXAMPLE
- Workers will attend safety meetings.
- This is measurable because you can track the number of workers that attend every month.
- This is not measurable because it does not track a number, rate, or percentage with respect to your goal.
- BAD EXAMPLE
- Safety meetings for workers will be held monthly.
- …
- Page 5
SECTION 2. USING LEADING INDICATORS
- There is no “one size fits all” way to use leading indicators. Employers with newer programs may use indicators that focus on starting a program, while employers with more mature programs may use them to monitor how close they are to achieving higher performance targets. Some employers may also find it helpful to limit the number of leading indicators they start out with or how many they use at any one time. How employers assign who will track and carry out goals for leading indicators can vary based on the size of the business, who the business has on staff, whether the business has a safety manager, and the scope of job duties of the employers’ workforce.
- This document will explain three approaches for developing leading indicators. The order in which they are listed does not suggest that any one approach is better. OSHA recommends using an approach that works best for you, or even a combination of two or more, that may help you to achieve a specific safety or health outcome.
- Leading indicators using data that you already collect to achieve a safety or health goal (Section 2.1).
- Leading indicators for controlling an identified hazard
- (Section 2.2).
- Leading indicators for improving a safety and health program element (Section 2.3).
- THE STEPS FOR USING LEADING INDICATORS
- PLAN
- Choose a Leading Indicator
- Choose the leading indicator you will use. (See Sections 2.1–2.3 for examples of approaches for developing leading indicators.)
- Set a Goal
- After you have decided on the leading indicator, set a goal for that indicator.
- DO
- Communicate
- …
- Page 6
2.1 Leading Indicators Based on Data You Are Already Collecting
- If you are just getting started with leading indicators, you may find it easier to work with data that you already collect, whether it is data that can improve an element of your safety and health program or data that can help address a hazard or achieve some other safety or health outcome. The following example shows how you can turn this data into a leading indicator to help you to achieve any one of these goals.
- EXAMPLE: Percentage of Workers Attending Safety
- Refresher Training
- workers that receive refresher training, and your goal is 100% of your workers completing the refresher training by the end of each quarter.
- Step 3: Start Using Your Leading Indicators
- 1. Collect the data.
- To collect the data, you may decide to review the attendance sheet that workers use to sign in before the training begins.
- Attendance Sheet
- Ron Dufresne
- Step 1: Choose a Leading Indicator
- Zhihao Chan
- Every quarter, you ensure that you have administered mandatory safety refresher training to your workers; however, in the past you noticed that some of your workers did not attend these trainings. Because you already keep track of who attends training, and you want to ensure that you provide adequate training to your workers, you decide that this might be good data to turn into a leading indicator. Therefore, you define your leading indicator as the percentage of workers that receive quarterly refresher training.
- Kim Layton
- 2. Periodically measure progress toward your goal and take action if you are not meeting it.
- Step 2: Set a Goal
- Step 4: Periodically Reassess Your Goal and Indicator
- …
- Page 7
- Below are three scenarios that could arise after you start tracking this leading indicator. Each scenario shows the kind of insights you can obtain and actions you can take once you start using your leading indicator.
- Scenario 1: You reviewed the attendance sheet from the last quarter. 70% of workers attended the mandatory refresher training—good, but below your goal of 100%. After discussing this with your workers, you learn that some of them did not attend because they were out from work that day. For the future sessions, you ensure that makeup sessions are scheduled and continue to track your leading indicator.
- Scenario 2: You reviewed the attendance sheet from the last quarter. The number of workers that attended the refresher training improved from the previous quarter, but you did not achieve your goal of 100%. After discussing this with your workers, you learn that some of them had already left work at the time the training was scheduled. You remind your workers that the training is mandatory and instruct them to notify a supervisor if they are unable to attend. You continue to track your leading indicator.
- Scenario 3: You reviewed the attendance sheet from the last quarter. The percentage of workers that attended the refresher training was 100%. You decide whether to continue tracking attendance every quarter after it has become routine (or consider decreasing the tracking frequency to every two quarters). Then begin to develop and track a new leading indicator for other data that you already collect.
- 2.2 Leading Indicators for Controlling an Identified Hazard
- …
- Page 8
Rewind air hoses
- Scenario 1: Workers are cleaning the assembly floors once daily, but trips and falls are still occurring. After discussing this with your workers, you find that they are completing the cleanups in the afternoon, but the floors are cluttered again by the time work starts in the morning. Based on this discussion, you change your policy to require workers to clean floors just before leaving work, and revise your leading indicator to the frequency of daily cleanups that occur at the end of the work day.
- Scenario 2: Workers are cleaning assembly floors once daily, and trips and falls have decreased but are still occurring. After discussing this with your workers, you learn that the daily cleanups are helping, but tools and equipment are being stored in areas that create narrow work stations and introduce new trip and fall hazards. You find other places to store tools and equipment and continue to track your leading indicator. You also invest in automatically retracting pneumatic hose reels and overhead connections to keep hoses off the floor, and consider converting to battery-operated tools to eliminate the use of hoses altogether.
- Scenario 3: Workers are cleaning assembly floors once daily, and trips and falls have decreased significantly.
- You decide whether to continue tracking the daily cleanups after they have become routine (or consider decreasing the tracking frequency from daily to weekly). Then begin to develop and track a leading indicator for a different hazard.
- In this example, your leading indicator is the frequency of inspecting and clearing the floors, and your goal is once daily.
- …
- Page 9
- learn that you were not replacing brake pads every 30,000 miles as recommended by the truck manufacturer. You decide that a good way to address this hazard might be to track the number of trucks that have the brake pads replaced every 30,000 miles. The number of incidents and injuries caused by trucks failing to stop is the lagging indicator that you hope to drive down with a leading indicator.
- TRUCK MILEAGE SINCE LAST BRAKE CHANGE
- Step 2: Set a Goal
- In this example, your leading indicator is the number of trucks with brake pads that are changed every 30,000 miles, and your goal is 100%.
- Step 3: Start Using Your Leading Indicators
- 1. Collect the data.
- To collect the data, you decide to submit a maintenance request to record the number of miles driven since the last time brake pads were changed. You check each truck on the first of each month, and use a sheet to check off the trucks that had brake pads changed every 30,000 miles.
- # of miles since last brake change
- Goal met?
- Truck A
- 26,000
- Truck B
- 30,200
- Truck C
- 27,300
- Truck D
- 29,000
- 2. Periodically measure progress toward your goal and take action if you are not meeting it.
- On the first of each month, you count the number of trucks that had brake pads changed at the 30,000-mile mark. If you did not change the brake pads every 30,000 miles, find out why and try to address the issue.
- Step 4: Periodically Reassess Your Goal and Indicator
- To assess your goal, determine if you are seeing a decrease in the frequency of worker incidents and injuries from trucks failing to stop.
- NUMBER OF INCIDENTS OR INJURIES FROM TRUCKS FAILING TO STOP
- …
- Page 10
Step 2: Set a Goal
- use the trucks without any knowledge of this hazard, and the brakes were never replaced. You start giving your maintenance staff the keys to trucks that require maintenance as soon as you identify this issue, and continue to track your leading indicator.
- Scenario 3: Every month, you review the number of trucks with brakes that were changed every 30,000 miles, and incidents and injuries have decreased significantly. You decide whether to keep tracking the brake pad changes every month after it has become routine (or consider changing the tracking frequency from monthly to quarterly). Then begin to develop and track a leading indicator for a different hazard.
- Step 3: Start Using Your Leading Indicators
- In this example, your leading indicator is the arrival time of your lift team, and your goal is for arrival to be within five minutes.
- 1. Collect the data.
- To collect the data, you may decide to have nurses use a timer that tracks how long it takes for a lift team to arrive to a room after the team has been paged. The nurses then note the time on a daily sheet that is posted on a board in the hallway and shared by all nurses on the floor.
- LIFT TEAM ARRIVAL TIMES
- EXAMPLE: Arrival Time of Lift Teams
- Step 1: Select a Leading Indicator
- Monday
- Tuesday
- Wednesday
- Thursday
- Friday
- During your hazard identification process, your hospital identified manually lifting patients as a hazard. A review of your injury log showed that in the past year 15 hospital workers suffered from back injuries after manually lifting or repositioning patients. …
- …
- Page 11
- Below are three scenarios that could arise after you start tracking this leading indicator. Each scenario shows the kind of insights you can obtain and actions you can take once you start using your leading indicator.
- Scenario 1: You review the sheet every week to make sure that lift teams are arriving within five minutes. While back injuries have decreased since you last checked your progress, they are still occurring. After discussing this with your workers, you learn that although lift teams are arriving within five minutes, you need additional lift teams because there are not enough available to get to the next patient when they are paged. Based on this discussion, you review your staff levels, decide to add three more lift teams with lifting equipment, and continue to track your leading indicator.
- Scenario 2: You review the sheet every week, and back injuries have decreased further since the last progress update but are still occurring. After discussing this with your workers, you learn that some lift teams are not using the equipment properly, causing them to fall behind on getting to the next patient. You plan a training session so that your lift teams can learn how to correct errors in using the equipment, and continue to track your leading indicator.
- Scenario 3: You review the sheet every week, and back injuries have decreased significantly. You decide whether to continue tracking lift team arrival times after it has become routine (or consider changing the tracking frequency from monthly to quarterly). Then, begin to develop and track a leading indicator for a different hazard.
- Hazard identification and assessment
- …
- Page 12
Leading Indicators That Support Management
- Leadership
- Below are some suggested leading indicators for measuring the implementation of recommended practices for management leadership:
- Leading Indicators That Support Worker Participation Below are some suggested leading indicators for measuring the implementation of recommended practices for worker participation:
- Percentage of managers and supervisors who attend mandatory safety and health training for workers.
- Number of workers asked for feedback on good safety goals ahead of safety meetings.
- Number of times each month that top management initiates discussion of a safety and health topic.
- Number of workers involved in developing safety procedures.
- Number of workers participating in tool box talks.
- Average score on survey questions related to workers’ perception of management’s safety and health commitment.
- Number of workers participating in injury investigations.
- Safety perception survey participation rate.
- Number of workers involved in developing task-specific job safety analyses/job hazard analyses on how to perform routine tasks safely.
- Number of workers participating in accident investigation teams and helping to identify/implement corrective actions to eliminate hazards.
- Number of worker-reported hazards or concerns for which employers initiated corrective action within 48 hours (compared to the total number of such reports).
- Average time between worker report of a hazard or concern and management acknowledgement of the report.
- Number of safety-related line items in budget and percentage of these fully funded each year.
- Take Action
- …
- Page 13
Leading Indicators that Support Hazard Identification and Assessment
- Below are some suggested leading indicators for measuring the implementation of recommended practices for hazard identification and assessment:
- Leading Indicators that Support Hazard Prevention and Control
- Below are some suggested leading indicators for measuring the implementation of recommended practices for hazard prevention and control:
- Length of time interim controls have been in place.
- Percentage of recommendations implemented that pertain to PPE hazard controls, administrative controls, engineering controls, substitution, and elimination.
- Number of special work permits filled out.
- Number of cartridge filers with an end of service life indicator that were returned or replaced before the indicator turned red.
- Frequency with which preventive equipment maintenance tasks are initiated and completed on schedule.
- Number of hours passed after an incident before an investigation is started.
- Number of hours passed after an incident before an investigation is completed.
- Percentage of incident investigations that include a root cause investigation.
- Percentage of daily/weekly/monthly inspections completed.
- Number of hazards identified where you used leading indicators to control the hazard.
- Percentage of inspections that include a follow-up inspection to ensure that the hazard has been controlled.
- Percentage of hazards abated on the same day, week, or month in which the hazard was identified.
- Number of workers required to wear respiratory protection.
- Number of unacceptable risks identified during risk assessments.
- Take Action
- …
- Page 14
2.3.7 COMMUNICATION AND COORDINATION
- Leading Indicators that Support Education and Training Below are some suggested leading indicators for measuring the implementation of recommended practices for education and training:
- Number of inspections completed to identify hazards or program weaknesses.
- Number of lagging indicator rates that improved as a result of using leading indicators to take action.
- Number of trainings provided to workers on hazard recognition and control as compared to worker attendance rates at these trainings.
- Number of goals achieved, number of goals in need of revision, or new goals that you should set for the following year.
- Percentage of workers receiving mandatory training on schedule.
- Percentage of incident investigations listing insufficient Number of workers trained on how to recognize and report a hazard or near miss as compared to the number of workers that report understanding the training they have received.
- Take Action
- Take action when trends indicate that you could improve an aspect of your program. For example, if you only conduct an audit once a year, this may not be enough to track how well your program is doing over time. Similarly, if you have not achieved an important goal, it may make more sense to continue working on that goal before pursuing a new one.
- Percentage of improvement on post-training assessment scores over pre-training assessment scores.
- Take Action
- Take action if trends indicate that you are not effectively administering training. For example, a leading indicator may reveal that you offer regular training on how to recognize and report hazards, but workers still do not clearly understand…
- …
- Page 15
2.3.8 E XAMPLES: USING LEADING INDICATORS TO IMPROVE A SAFETY AND HEALTH PROGRAM ELEMENT
- Number of hazards reported by contract/temporary workers versus total site workers.
- Number of audits conducted to ensure contractors are following site safety and health policies to include in their own safety policies.
- and give an update on safety and health performance. The update could include status of your safety and health leading indicators and a discussion of any new safety and health issues.
- Step 2: Set a Goal
- Take Action
- Take action if a trend indicates that you could improve communication and coordination activities. For example, you might find that contract workers and host employers are not having frequent discussions about worker safety because the contract workers are not comfortable discussing their concerns with the host site supervisor. In this example, you might plan a meeting between your workers and the supervisor to discuss what actions the supervisor can take to help the workers feel more comfortable about having these discussions.
- In this example, your leading indicator is the percentage of monthly safety meetings in which a manager attends and gives a safety and health update. You hope to strengthen the management leadership element of your program. Using results from the next survey, you intend to measure your success by looking for a higher percentage of workers who agree that management communicates its commitment to safety and health.
- To collect the data, you may decide to keep a sheet that notes whether a manager attended a monthly meeting, including a section on what safety and health updates the manager provided.
- …
- Page 16
MANAGER SAFETY MEETINGS AND SURVEY RESPONSES
- Percentage of monthly safety meetings including manager update
- Percentage of “yes” survey responses
- January
- February
- March
- April
- of management commitment to safety in a short time, it may take longer to determine whether your indicator is effective in achieving this goal. You should review the results regularly, but consider whether you need more time to assess effectiveness.
- Tracking Completion of Action Items from Inspections to Improve Hazard Prevention and Control
- Below are three scenarios that could arise after you start tracking this leading indicator. Each scenario shows the kind of insights you can obtain and actions you can take once you start using your leading indicator.
- While evaluating your safety and health program, you decide to review your program evaluation and improvement practices and identify areas for improvement. You decide to track the number of past-due action items since your last inspection. You set a goal not to exceed 10% on past-due action items before completing your next review.
- Scenario 1: The manager attends the meetings and provides safety and health updates to all your workers monthly, but the percentage of “yes” responses to your survey has not significantly improved. After discussing this with your workers, you learn that some would like a more detailed explanation about why you are using certain leading indicators. You add this to your discussion points and continue to track your leading indicator.
- Scenario 2: The manager attends the meetings and provides safety and health updates to all your workers monthly, but the percentage of “yes” responses to your…
- …
- Page 17
- Each quarter of the year, you calculate your percentage of past-due action items. If you did not complete at least 90% of your action items, find out why and try to address the issue.
- Step 4: Periodically Reassess Your Goal and Indicator
- To assess your goal, determine what percentage of outstanding action items you have not completed. Is it no more than 10%?
- Below are three scenarios that could arise after you start tracking this leading indicator. Each scenario shows the kind of insight you can obtain and actions you can take once you start using your leading indicator.
- Scenario 1: Before completing your next review, you check your results and notice that your percentage of total action items not completed is above 10%. After discussing this with your workers, you learn that no procedure exists to ensure that you would complete your action items on time. You also learn that it may be helpful to give the action item list to a manager to ensure that workers meet the due dates. You set a meeting with your workers to come up with a procedure for completing action items on time, begin giving the list of action items to a manager at the conclusion of each inspection, and continue to track your leading indicator. You also make this tracking log available to workers so they can become more involved with ensuring timely completion dates.
- Scenario 2: Before completing your next review, you check your results but your percentage of total action items not completed is above 10%. After discussing this with your workers, you learn that the equipment, parts, or tools needed to complete some of the action items were not available. …
- …
- Page 18
SECTION 3. CONCLUSION
- Leading indicators are a valuable tool that you can use to make measurable and long-lasting improvements to safety and health outcomes in the workplace. Leading indicators can be valuable regardless of whether you have a safety or health program, what you have included in your program, or what stage you may be at in your program. Use the checklist below to get started today.
- ACTION PLAN CHECKLIST
- Identify your top problem areas. For hazards, review your injury logs, and results from your hazard assessments. Start with the hazard with the greatest risk of harming workers by evaluating the severity of the potential exposure and the likelihood that an incident could occur. Prioritize hazards over other areas of your program, particularly if a threat is imminent.
- For other program elements, talk with your workers about what areas you could improve. For data that you are already collecting, determine whether it is an area that you should prioritize.
- Consider what actions you could take to address your key areas. Talk with your workers and anyone else with knowledge of the issue that can provide suggestions.
- Set a goal, and use leading indicators to reach it. Make an informed decision on what your goal should be and how long it might take to achieve. Choose a leading indicator that can help you to achieve your goal over time.
- Collect the data. Begin collecting the leading indicator data for the time period you decided on as well as the data for your goal during that same time period.
- Periodically review the results. Assemble the results into a graph to determine whether there is a positive relationship between your leading…
- …
More on Managing Safety
Hazard Identification Plan
Construction Safety Improvement Program module on how to find and document jobsite hazards, from the Building Industry Association of Hawaii.

Incident Investigation Procedure
Construction Safety Improvement Program module on incident and near-miss investigation and root causes, from the Building Industry Association of Hawaii.

Leadership Commitment to Operational Safety
Construction Safety Improvement Program module on management leadership and commitment to safety, from the Building Industry Association of Hawaii.